Post Summary: A CES Overview
This is an anonymized interview that I had with the Head of a Global Customer Support team. He was labeled as an expert in Customer Effort Score (CES), so I reached out to him in Support Driven, a fast-growing Slack group where Support Professionals can connect with one another. I wanted to better understand CES, how to implement it, and generally find another connection in the support world.
Throughout our discussion I received more than I was expecting. He blew me away with how thoroughly he explained the concepts along with how thoughtfully they researched and implemented CES. This post is my way to give back to the Support Driven Community.
In this interview we learn more about his decision to use CES, what CES is, and an idea of how to implement it. Without further ado, here’s the interview.
Interview
Tell us about your team:
We’re a team of ~50 people, working 24/7, doing about ~10k tickets per month! We’re spread between [California, South America, and Eastern Europe]. Our team is extremely knowledgable about our product and the questions we receive are very in-depth. We support [sic] software, and answer all conceivable questions about how to use the product, best practices, etc. A typical customer response is 3–5 paragraphs, written free-form and customized for each inquiry. Our team really knows the product inside and out!
In order to keep this all running, we support our agents with 3 tier-1 support managers, a manager for tier-2, a documentation writer, and an extensive training team of 3 people. The training team onboards 2–5 people per month, and it takes 2–2.5 months to become fully proficient!
What type of performance do you measure?
We measure the typical things such as Time to First Response. We also have targets to answer all 90% of chats within 30 seconds and 90% of calls within 60 seconds. In the past we measured CSAT which we’ve replaced with Customer Effort Score (CES).
What inspired you to implement CES?
Last year I read the book called The Effortless Experience: Conquering the New Battleground for Customer Loyalty (presentation), and chapter 6 completely changed how I thought about measuring the customer experience; It inspired me! It provides different ways to phrase questions and receive results for customer feedback. It’s very scientific yet easy to understand. The whole book is great!
The book claims that CSAT provides zero insight into the real meaningful indicators for a business. This made an impact on me because we were facing the same challenge as many other Zendesk customers. The Zendesk CAST benchmark results show that everyone scores ~95%. It was a very inaccurate signal without real meaning for us. In 2015 we did achieve a 96.5% CSAT rating! ← Great work!

Zendesk’s Built in CSAT Email
The core element of CES is to understand a customers likelihood to repurchase, and we wanted a way to tie back a customer’s experience to sales which is our business’s lifeblood. This led us to start investigating how to implement CES.
Tell us what CES is?
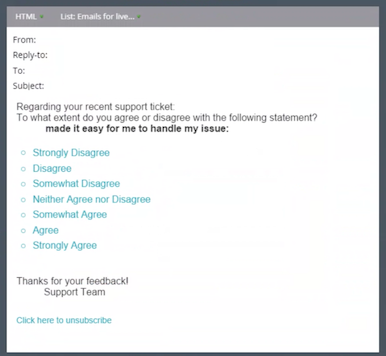
Customer Effort Score is a question that asks if “the company made it easy for me to handle my issue” and allows the customer to answer on a range from “strongly disagree” to “strongly agree”.

What was the implementation process like?
Towards the end of 2015 we started to do research for 3rd party tools and found that no one really has an out of the box customer effort survey integrated with Zendesk Triggers. We chose to implement a customer email via Survey Gizmo.
 First CES Survey Version from January 2016
Upon implementation, we immediately started to see a substantial decrease in our response rate. With Zendesk, we saw an 18% response rate when asking customers for CSAT. The reply rate dropped to 8% because no one wants the promise of a “2 minute survey” that will actually take 10 minutes. Fortunately, we had engineering support and we started to build our own tool in January which would embed the question directly in the email.

Updated CES Email
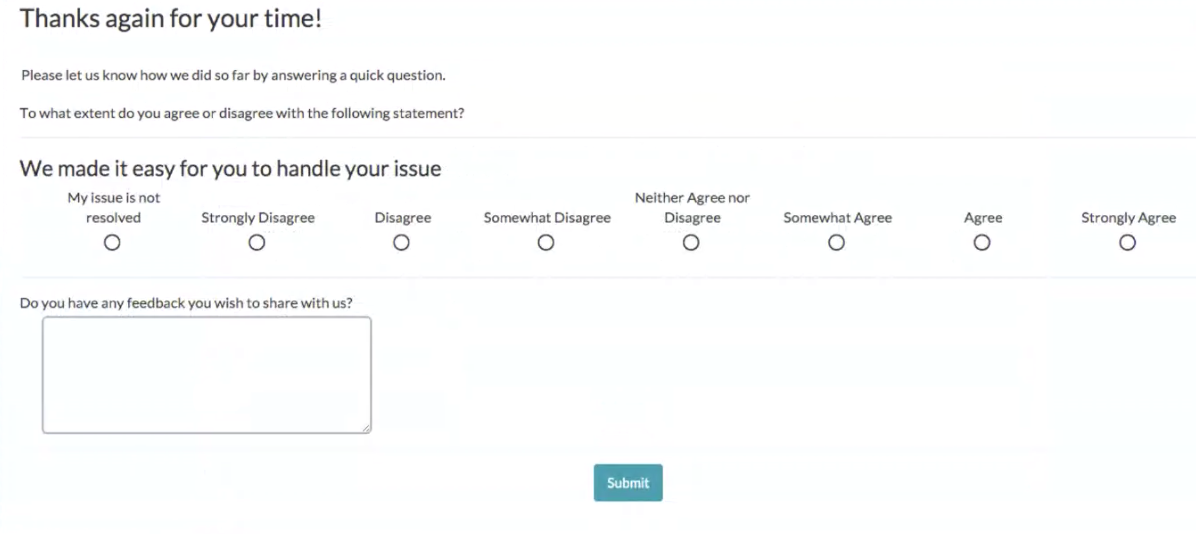
We custom-built a service that would listen for the Zendesk solved ticket trigger. The service sits between Zendesk and Marketo, which we use to email customers. When a customer selects their response [in the email] it saves the feedback and they land on a page where they can provide comments.
Our response rate shot up to 22%, which was even greater than our CSAT measurement!
 Example of how to capture comments in a custom-built tool
How do you calculate CES?
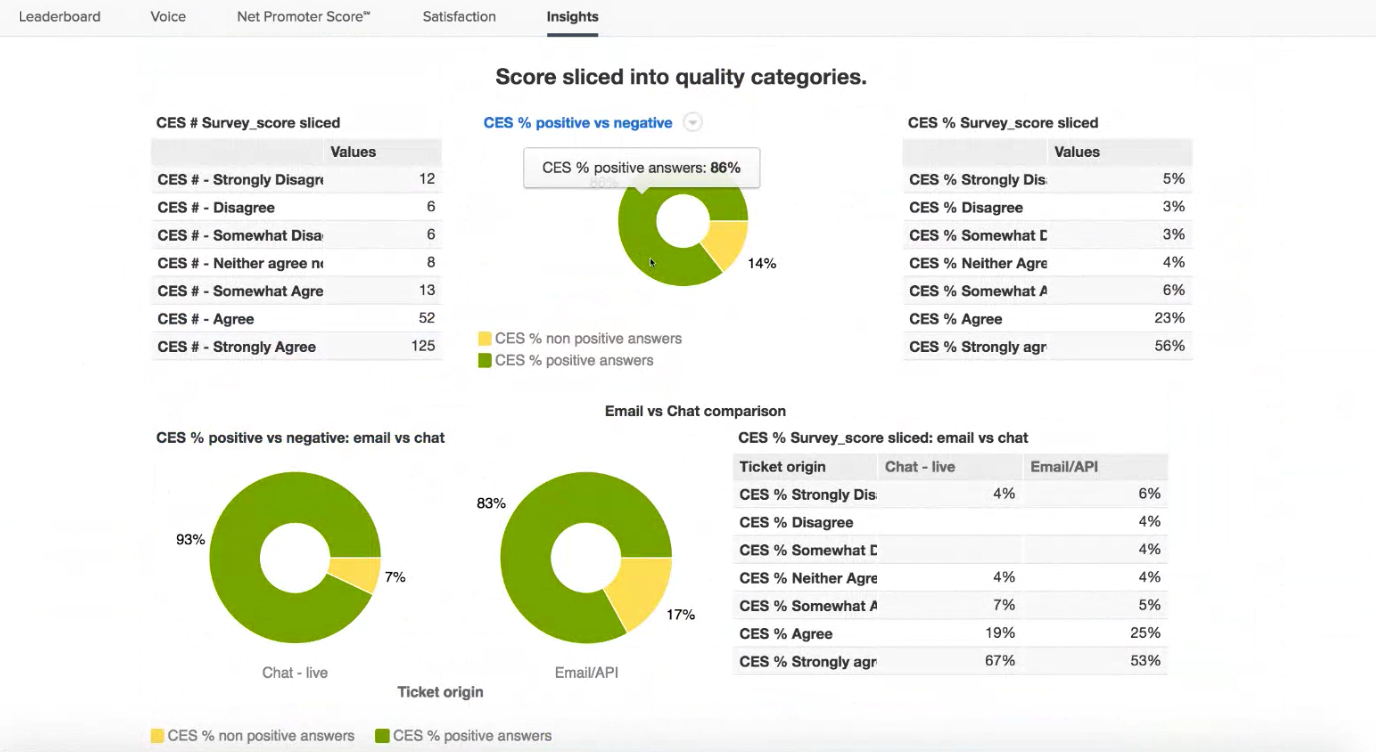
When we capture a customer’s response we push the rating and comments into Zendesk via their API. We get a lot of comments and they’re added directly to the original ticket in the form of internal notes. We perform data analysis using GoodData. If a customer Agrees or Strongly Agrees, we consider it a positive interaction, everything else is a thumbs down.
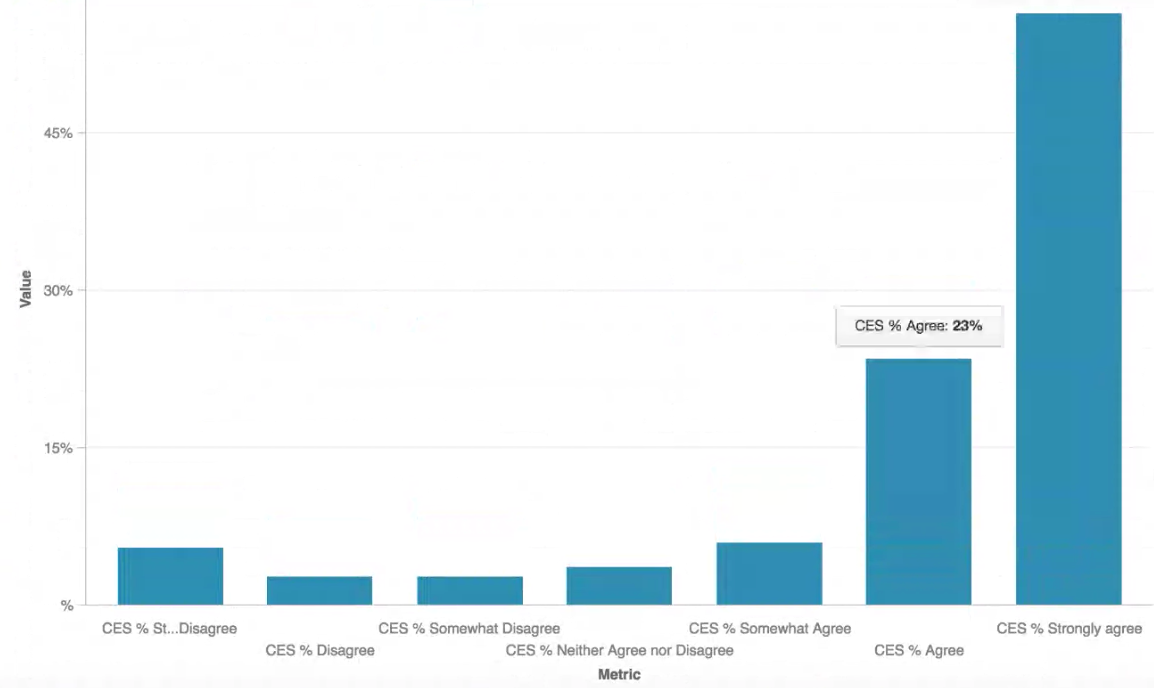
They look at the percentage they receive in each category:
 Sample CES Dashboard
Ideally, more customers would respond with “Agree” over “Strongly Agree” because Strongly Agree indicates that it’s not a complicated question and could be solved effectively with self-service. If a high percentage of strongly agree, it might be the difference between hiring a 20 person team vs. 30 person team. In the book, it says the ideal graph shape is a bell-curve.
When a customer emails us, our agents are responsible for tagging a ticket for the main topic. It’s a mandatory field in order to solve a ticket. When we do analysis we tie CES to the ticket, agent(s), and product feature to identify where the holes are.
What insight has CES provided?
From an insights standpoint, we haven’t drawn out anything super insightful yet because we know [the existing] challenging items for the customers. The biggest difference from CSAT is that CES is a stronger signal, it’s so much more distinct. With CES the same topic will be overwhelmingly 50% positive vs 80% with CSAT.
 Sample CES Dashboard in GoodData
Rapid fire, what else should we know about CES?
-
We want to redo [the email] on a linear scale & not vertical.
-
Make sure your answer links are clickable in the email.
-
Think about the time to solve the ticket and send the email, we wait 24 hours. One partner from New Zealand found that 10 hours was ideal. You’ll want to wait long enough to know that they won’t follow up with another question.
-
You may uncover organizational challenges with low scores. We have our lowest satisfaction score when we pass to [sic] because they don’t follow up immediately.
If you have comments, questions, or further insight please reach out.