Summary
The second step in creating a robust playbook is to narrow the data grouping and categorize your customer interactions. In this post, I will explain how to do a secondary level of data analysis for your Playbooks so you can create specific and focused content.
Data Grouping
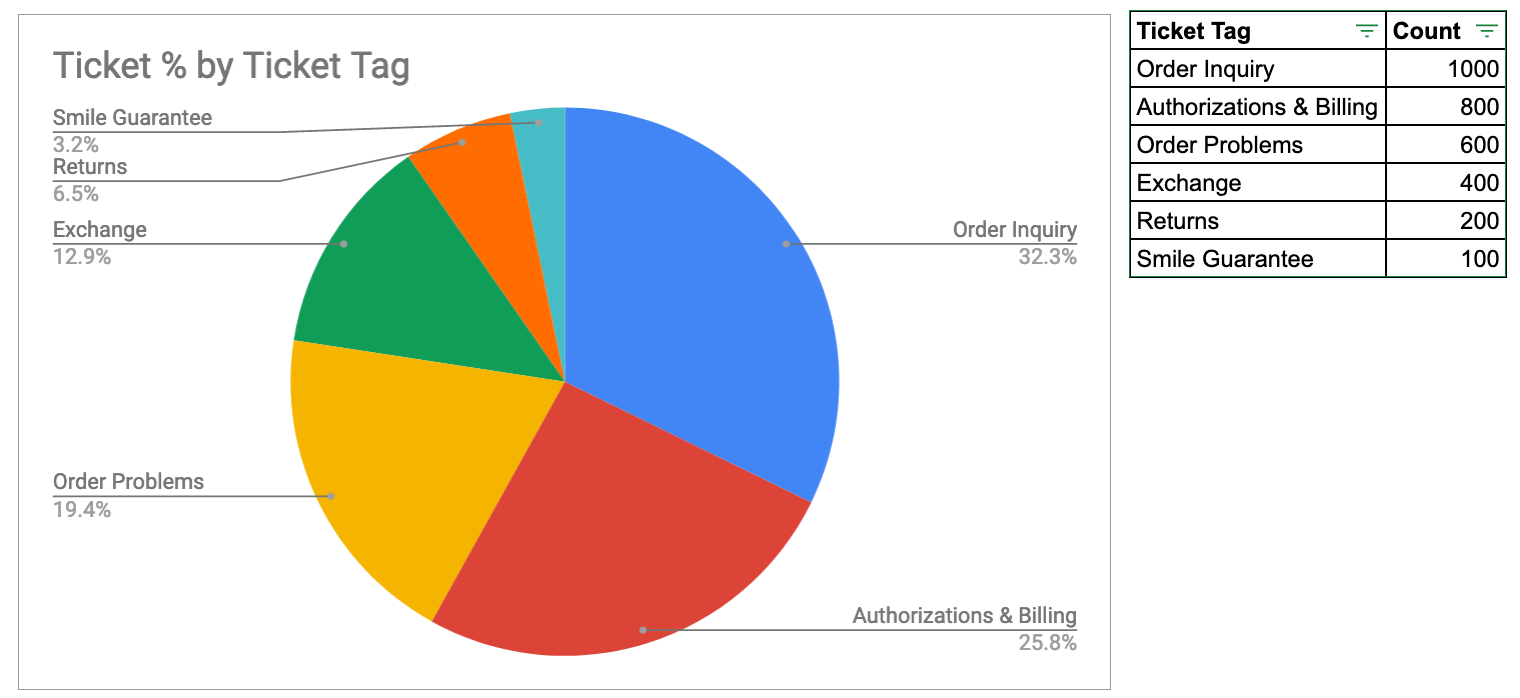
Now that you've downloaded and analyzed thousands of tickets in a calibrated way (see Step 1: Mapping Customer Interactions), what's the next step? It's important to group your data into more specific categories and create a visualization so that you can better understand it. Again, here's an example from the Google Doc for an E-Commerce company.
Methods to Group Your Data
For an E-Commerce company, I would suggest grouping your tags around broad categories of questions that you might receive, such as Pre or Post-sale questions. Another consideration in your grouping could be how they align with cross-functional teams in the company. Examples include:
- Pre-Sale: product education, product comparison, or shipping details/issues
- Post-sale: order status, returns/exchanges, or fraud
- Cross-functional Team: Order fulfillment, warehousing, purchasing, or product design
Said another way: You need to identify why your customers are contacting you? Is it because they have a question about the dimensions of your product or maybe because your company didn't fulfill a promise such as a guaranteed shipping time. It is vital to know the driver of why you're receiving the question so that you can create a solution, not just that your customers are asking questions.
I've separately included details for how a Technical CX team that operaties in a complex/multi-product environment can think about a data grouping structure. The crucial difference that I've seen between shipping physical goods and supporting software, is that tracking down the owner of a software-related issue can be more challenging and might require additional levels of classification.
Perform a Gut Check
The first question that I would ask myself is if the distribution of my tickets matches my own gut feel. In this case: “Does the team spend about 1/3 of their time answering Order Inquiry questions and 1/4 on Billing?” If the distribution feels off to you then got back and analyze more raw data. Likely, your data pull wasn't comprehensive enough.
Once you're comfortable with the distribution, the second question that I would ask is: “Are my categories too broad/narrow or just right?” As mentioned in the Top Tagging Tip, you will know if your categories are right by how much time you forecast it would take to train someone on the topic so that they can handle 80% of the volume with 20% being learned on the job. For example, if the training would take 2 hours or 5 days, you would likely need to broaden or narrow the scope of the training. This is a guideline and there are always caveats, a few of which include how technical the topic is, what's the baseline level of knowledge, or do you need to simultaneously train your team on systems.
So Now What?
Once you believe that your categorization adequately represents your data here are your next steps:
- Decide on which category to dive further into. I recommend either the category you think is the simplest, the one that causes the most headaches, or the one with the highest volume.
- You will then dig deeper to uncover scenarios within the broader category and take the next step in creating your playbook.
- Once you gain some experience, you can get to this deeper level of understanding in your first pass.
Below is an example of doing a second-level analysis of interactions tagged as Order Inquiry. Remember, you can either get to this level in your first-pass (like a pro), or more commonly, you'll get to this secondary level in your second tagging session.
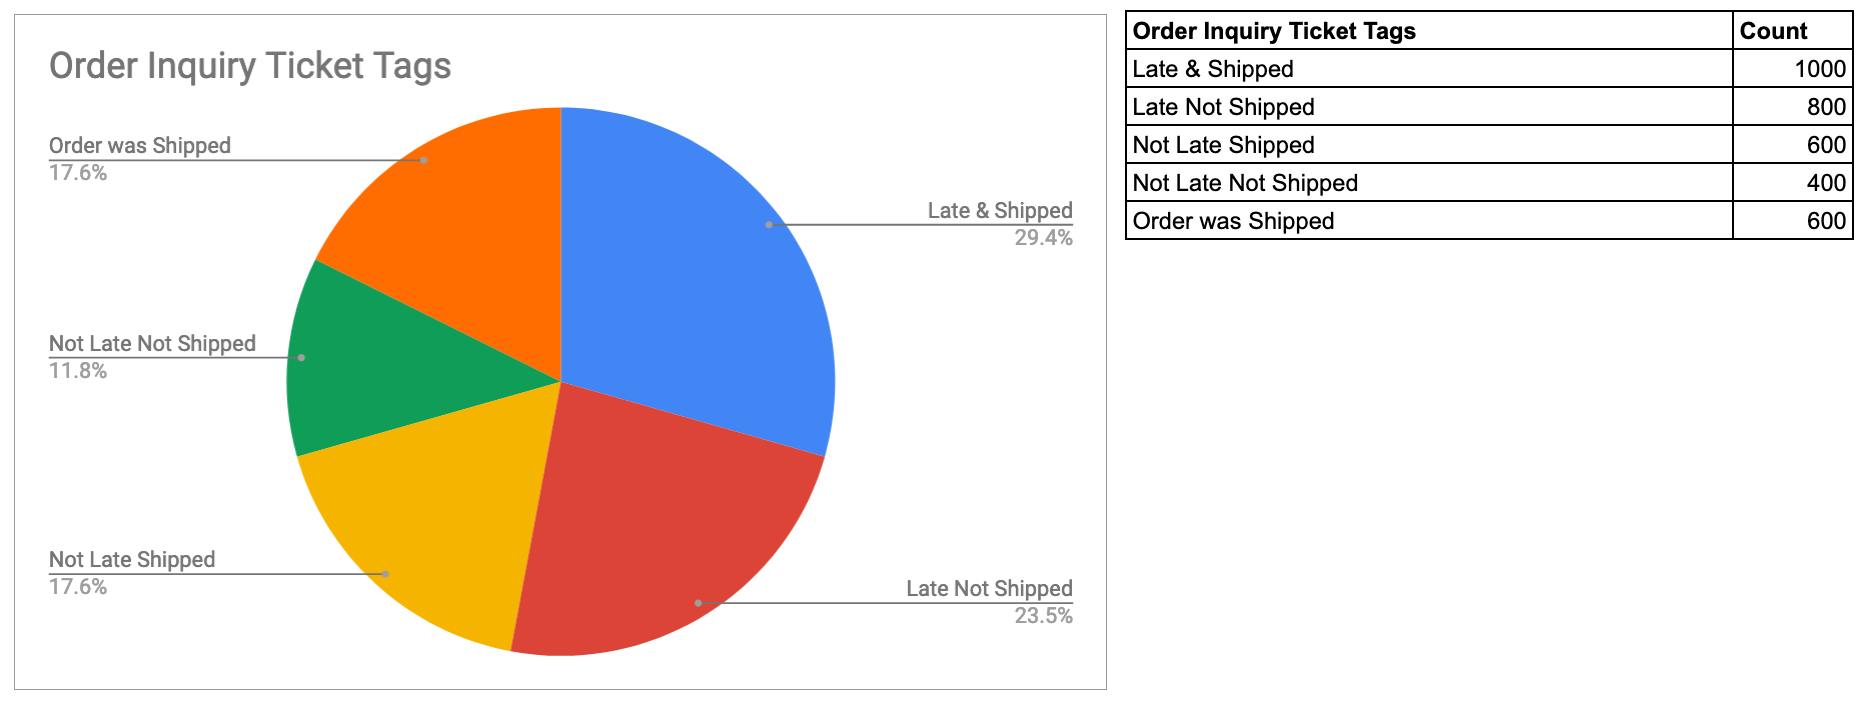
It's important to keep in mind that the tags here DO NOT necessarily represent your ideal workflow. They only represent what happens today. For example, when I was at Fab.com, in the early days we did a lot of dropshipping so we realized that telling a customer they could expect their item to ship in 2 days wasn't sufficient. We had to develop our ideal workflow which we cover in the next section called Creating Visual Workflows.
TLDR for Executives
Data Grouping…
-
This is the detail of what's happening with your customers, why they contact you, and issues inside of your company, so PAY ATTENTION!
-
If your operational teams don't have details beyond a high level, such as order inquiry, then ask them to perform a deeper analysis. Also, be kind, it takes planning and analysis to get it right
-
Resist the urge to tell the team what to do. Instead, provide the guiding principles of what you want to see (High CSAT, faster ship times, lowest costs) and let the team figure it out through their process mapping. Process mapping is another name for a visual workflow.
TLDR for Operators
Data Grouping…
- Is an excellent way to get deeper details on your interactions and to be the go-to expert on your company's customers. Don't hoard data, but make sure you prove the value of your team's work.
- Is a structure for you to see your team's work and how you can improve it
- It could scare the shit out of you. It's normal to ask yourself/team questions like “wow, why do we do that?” or “OMG, we get that many questions? I thought we were better at X”. This is the first step in understanding before you get to fixing - which is the fun and hard part.